DoItWithAI.tools Logo
Free AI Blog Infographic Studio · No Signup · Zero Watermark 4.9/5

AI BLOG SECTION INFOGRAPHIC GENERATOR · 25 CANVA & NAPKIN LAYOUTS · SVG & WEBP

Free AI Blog Section Infographic Generator: 25 Canva & Napkin-Style Visual Templates

Turn any blog H2 heading, paragraph, bullet list, or article URL into a crisp, 100% editable section diagram. Choose from 25 deterministic layouts (pipelines, versus cards, KPI bento grids, pyramids & checklists), add your brand logo and ring-framed executive portrait, and export HD PNG, vector SVG, WebP, or PDF at $0 API cost.

Use in Do It AI →
Template #1 · Process Flow16:9 · 1:1 · 4:5 · 9:16

4-Stage Autonomous Blog & Visual SEO Pipeline

Turn 1 keyword into a 2,000-word article + editable H2 diagrams

01<10ms
Intent & Cluster
Primary keyword + LSI entities
02512px
<580px Meta Pack
Zero SERP ellipsis truncation
03$0 API
25 H2 Diagrams
Editable Canvas & vector SVG
04100 CWV
JSON-LD @graph
BlogPosting + FAQPage schema
Sufian Mustafa
Sufian Mustafa
Founder · DoItWithAI.tools
DoItWithAI.tools · Zero-Token HTML5 & SVG Engine
Template #1 · Process Flow · Click any tab to preview

Extracting Article & Generating Output in 1 Click...

Scanning headings, key takeaways, and article images—Topic #1 is auto-selected so your output renders immediately.

Your results will open below when the check finishes.

1-Click Auto-Extract & Generate from Any Article or YouTube URL
25 Canva & Napkin.ai-Style Blog Infographic Layouts · Zero API Cost

Interactive Blog Section Infographic & Diagram Studio

1 · Brand Logo & Optional Author Ring Frame
Author / Executive Portrait Badge (or Diagram Only):
Logo / Brand Badge Scale & Style100%
2 · H2 Headline, Subtitle & SEO Alt Text
3 · Diagram Nodes (4/8)
4 · Brand Palette, Hex & Size
Template #1 · 16:9 HD
Horizontal 4-Step Process Pipeline · 16:9 Blog & OG (1600×900)
100%

Choose from 25 Live Blog Infographic Templates (Click to Switch Instantly)

Every thumbnail below is rendered live with your current H2 headline, nodes, brand palette, logo, and portrait—switching templates never resets your edits.

Quick Answer · Free AI Blog Section Infographic Generator

How do you create an SEO blog section infographic that ranks and converts?

To create a high-retention blog section infographic, convert each H2 heading into 3–6 structured visual nodes paired with quantified KPI badges, match the section intent to a process pipeline, versus card, bento grid, or pyramid layout, apply your brand logo and hex palette, and embed zero-CLS WebP or vector SVG markup with descriptive alt text.

Simple 3-Step AI Visual Workflow

How does the Free AI Blog Section Infographic Generator work?

Go from a raw H2 heading, paragraph, or published blog URL to a publish-ready diagram in under 30 seconds.

1

Enter H2 heading, paste text, or extract URL

Type your H2 headline and nodes, paste a raw paragraph to auto-split into diagram cards, or extract multiple H2 sections directly from any public article URL.

2

Customize logo, ring portrait & brand colors

Upload your company logo, pick from 8 curated brand palettes or custom hex colors, and optionally enable a ring-framed or arch-framed executive portrait.

3

Switch across 25 live layouts & export HD

Click any of the 25 live miniature canvas previews to test different visual families without losing your text. Export as PNG, vector SVG, WebP, PDF, CWV HTML, or a multi-section .ZIP.

25 Built-In Canva & Napkin.ai-Style Blog Layouts

Every blog infographic template engineered for zero-overlap clarity

All 25 templates adapt across 16:9 Blog/OG, 1:1 Square, 4:5 LinkedIn, and 9:16 Story/Pin dimensions with crisp, editable typography.

  • #1. Horizontal 4-Step Process Pipeline

    Process & Step Flows

    Best for: How-To Steps & Workflows · Title, Subtitle, 4–6 Step Badges, Step Titles, Step Descriptions, Accent Color

    Preview in live studio above ↑
  • #2. Vertical Milestone Roadmap

    Process & Step Flows

    Best for: Implementation Phases & Timelines · Header, Phase Tags, Milestone Titles, Deliverables List, Footer Note

    Preview in live studio above ↑
  • #3. 4-Stage Growth Flywheel Diagram

    Process & Step Flows

    Best for: Compound Loops & Flywheels · Center Core Label, 4 Orbit Nodes, Arrow Captions, Theme Palette

    Preview in live studio above ↑
  • #4. Zig-Zag Customer / Reader Journey

    Process & Step Flows

    Best for: Onboarding & Transformation Guides · 5 Touchpoints, Metrics Badges, Action Labels

    Preview in live studio above ↑
  • #5. 4-Tier Conversion & SEO Funnel

    Process & Step Flows

    Best for: TOFU / MOFU / BOFU Strategy Sections · 4 Funnel Stages, Conversion %, Key Tactics per Tier

    Preview in live studio above ↑
  • #6. Head-to-Head Versus Battle Card

    Comparison & Versus

    Best for: Tool A vs. Tool B Comparisons · Contender A/B Names, 5 Criteria Rows, Winner Badges, Verdict Footer

    Preview in live studio above ↑
  • #7. 3-Option Comparison Matrix Table

    Comparison & Versus

    Best for: Software & Pricing Comparisons · 3 Column Headers, 6 Feature Rows, Status Icons (✓/✗/⚡), Best Value Tag

    Preview in live studio above ↑
  • #8. Before vs. After Impact Split Card

    Comparison & Versus

    Best for: Case Studies & Optimization Results · Old Way Pain Points (Red), New Way Wins (Emerald), Delta KPI Badge

    Preview in live studio above ↑
  • #9. Pros & Cons Executive Grid

    Comparison & Versus

    Best for: Product Reviews & Trade-Off Analysis · Product Title, 5 Pros, 5 Cons, Bottom-Line Rating Score

    Preview in live studio above ↑
  • #10. Best Practices: Do's vs. Don'ts Board

    Comparison & Versus

    Best for: Mistakes to Avoid & Guidelines · 4 Green Do's with Icons, 4 Red Don'ts with Icons, Pro Tip Banner

    Preview in live studio above ↑
  • #11. 4-Card Bento KPI & Metric Callout

    Data, KPI & Stat Callouts

    Best for: Key Statistics & Benchmark Sections · 4 Big Metric Numbers, Trend Arrows (+%), Context Captions, Source Citation

    Preview in live studio above ↑
  • #12. Spotlight Stat + 3 Key Insights

    Data, KPI & Stat Callouts

    Best for: Industry Research & Survey Findings · Primary Giant Percentage/Number, 3 Supporting Bullet Cards, Source URL

    Preview in live studio above ↑
  • #13. Horizontal Performance Bar Chart

    Data, KPI & Stat Callouts

    Best for: Speed, ROI & Score Comparisons · Chart Title, 5 Labeled Bars, Numeric Values, Unit Suffix, Highlight Bar

    Preview in live studio above ↑
  • #14. Cost vs. ROI Savings Calculator Card

    Data, KPI & Stat Callouts

    Best for: Budgeting & Financial Breakdowns · Baseline Cost, Optimized Cost, Net Savings, Time Saved, Payback Period

    Preview in live studio above ↑
  • #15. 5-Pillar Audit Scorecard

    Data, KPI & Stat Callouts

    Best for: SEO, Performance & Quality Audits · Overall Score Ring (0–100), 5 Sub-Pillar Scores, Status Pills

    Preview in live studio above ↑
  • #16. 2x2 Impact vs. Effort Quadrant

    Frameworks & Pyramids

    Best for: Prioritization & Strategy Frameworks · X/Y Axis Labels, 4 Quadrant Titles (Quick Wins, Big Bets, etc.), Item Pills

    Preview in live studio above ↑
  • #17. 3-Tier Strategy Hierarchy Pyramid

    Frameworks & Pyramids

    Best for: Foundational vs. Advanced Concepts · Foundation Layer, Execution Layer, Apex Layer, Side Annotations

    Preview in live studio above ↑
  • #18. 3-Pillar Synergy Overlap Diagram

    Frameworks & Pyramids

    Best for: Core Intersection Concepts (e.g. SEO + UX + AI) · 3 Outer Pillar Titles + Bullets, Center Sweet-Spot Label

    Preview in live studio above ↑
  • #19. Hub-and-Spoke Topic Cluster Map

    Frameworks & Pyramids

    Best for: System Architecture & Internal Linking Maps · Center Pillar Node, 6 Connected Spoke Nodes, Connection Labels

    Preview in live studio above ↑
  • #20. 8-Point Actionable Launch Checklist

    Checklists & Cheat Sheets

    Best for: Pre-Publish & Implementation Checklists · Checklist Title, 8 Checkboxes with Labels & Priority Tags, Completion Badge

    Preview in live studio above ↑
  • #21. Executive 5-Point TL;DR Takeaway Card

    Checklists & Cheat Sheets

    Best for: Top-of-Article Key Takeaways & Summaries · Header Badge, 5 Numbered Key Takeaways, Reading Time Pill

    Preview in live studio above ↑
  • #22. Anatomy of a High-Converting Page

    Checklists & Cheat Sheets

    Best for: Structural & Template Teardowns · Central Wireframe Box, 6 Numbered Callout Pointers & Explanations

    Preview in live studio above ↑
  • #23. 3 Common Myths vs. Proven Reality

    Checklists & Cheat Sheets

    Best for: Debunking Misconceptions & FAQ Sections · 3 Myth Badges (Strikethrough), 3 Verified Fact Cards, Evidence Note

    Preview in live studio above ↑
  • #24. 6-Box Quick Reference Cheat Sheet

    Checklists & Cheat Sheets

    Best for: Formulas, Prompts & Command Reference · 6 Categorized Mini-Cards with Copyable Formula/Rule Snippets

    Preview in live studio above ↑
  • #25. Widescreen 16:9 Blog Hero & 1200x630 OG Banner

    Hero, OG & Quote Cards

    Best for: Article Featured Image & Social Share Card · Category Pill, H1 Title, Author Badge, Read Time, Visual Metric Preview

    Preview in live studio above ↑

Built for Visual SEO & High Dwell Time

Who uses our Free AI Blog Section Infographic Generator?

SEO blog posts & pillar guides

Place a structured process pipeline, comparison matrix, or KPI bento card under every H2 heading to boost reader dwell time and earn image search impressions.

SaaS & B2B product comparisons

Use Template #6 (Head-to-Head Versus Card) or Template #7 (3-Tier Feature Matrix) to visually prove why your platform outperforms legacy alternatives.

AI automation & SEO agencies

Turn client audit scores, ROI savings, and 90-day implementation roadmaps into branded executive graphics with the client's logo and hex palette.

LinkedIn & X/Twitter thought leadership

Switch any blog diagram to 1:1 Square or 4:5 Portrait to turn long-form H2 sections into high-engagement social feed graphics.

Digital PR & original data studies

Package survey findings and benchmark bars into downloadable SVG and PNG stat cards that journalists and niche bloggers love to embed and cite.

Newsletters, SOPs & documentation

Replace walls of instructional text with 8-point checklists, 6-box cheat sheets, and annotated page anatomy diagrams.

Industrial-Grade Blog Visual Engine

Why our 25-Template Studio beats diffusion image prompts & paid diagram tools

100% crisp, editable typography (zero garbled AI text)

Diffusion image models paint raster pixels and routinely misspell labels inside flowcharts. Our HTML5 Canvas and vector SVG engine renders razor-sharp, live-editable typography every time.

Brand logo, hex palette & ring portrait framing

Upload your brand logo, apply custom hex colors across all 25 layouts, and optionally frame an author or founder portrait inside concentric rings or an arch window.

Zero-CLS Core Web Vitals HTML, SVG & WebP exports

Export lightweight vector SVGs, compressed WebPs, or copy ready-to-paste <figure> HTML with explicit width and height attributes for 0.000 layout shift.

CapabilityDoItWithAI 25-Template Infographic StudioPaid Diagram SaaS (Napkin / Venngage)Raw AI Diffusion Image Prompts
Blog-Specific Infographic Templates25 Layouts across 6 Families (Pipelines, Versus, Bento KPI, Pyramids, Checklists, Hero OG)Limited on free tierUnstructured random art
Typography & Live Node Editing100% Editable Badges, Titles, Details & Metrics (Zero Typos)Editable (requires account login)Frequent misspelled / garbled text
Author Ring Framing & Brand Logo UploadAuto Background Cutout + Ring/Arch Sliders + Custom Logo PillPaid Brand Kit tier onlyNot supported
Export Formats & Pricing100% Free · PNG, Vector SVG, WebP, PDF, CWV HTML & .ZIP$18–$49/mo subscriptionPer-image credit cost + flat raster
Do It With AI · Unified Multi-Tool Command Center

Want to generate the full SEO blog post AND all H2 infographics automatically? Just Do It With AI.

Instead of jumping between separate tabs for keyword clustering, article drafting, diagram design, and schema validation, you can do it with AI inside our Do It AI Workspace. Chain our Free AI Blog Writer, AI Content Writer Studio, and this 25-Template Blog Infographic Studio in one seamless pipeline.

121+ Connected AI SEO & Visual Tools 25 Editable HTML5 & SVG Diagram Layouts Zero Signup · Instant Browser Execution

Related free AI tools for blog writing & visual distribution

Ready-Made Prompt Libraries

Copy-paste AI prompt packs for infographics, repurposing & AEO

Browse all 952+ prompts
Infographic, Data Visualization & H2 Diagram Prompt Library77 VISUAL & CHART PROMPTS

Infographic, Data Visualization & H2 Diagram Prompt Library

Copy-paste prompt frameworks to turn raw research notes, statistics, and SOPs into structured 4-node and 6-node infographic copy.

Act as an Information Designer. Compress this H2 section into 4 scannable diagram nodes with a 2-word badge, 4-word title, and 1 KPI metric...
Blog-to-Carousel & Visual Content Repurposing Prompts87 REPURPOSING PROMPTS

Blog-to-Carousel & Visual Content Repurposing Prompts

Turn every H2 section of your blog post into LinkedIn carousels, Pinterest pins, and executive summary cards.

Convert each H2 heading in [Article] into a standalone visual takeaway card with a before-vs-after transformation hook...
AI Search (AEO), E-E-A-T & Visual Entity Optimization Prompts94 AI SEO & AEO PROMPTS

AI Search (AEO), E-E-A-T & Visual Entity Optimization Prompts

Optimize image alt text, 50-word AI Overview answer boxes, and structured data so Google and Perplexity cite your visuals.

Write a 50-word AEO direct answer and 4 descriptive infographic alt-text strings that naturally include our primary entity...
Editorial Playbooks & Guides

Deep-dive SEO, AEO & visual content architecture guides

View all editorial guides
What to Do After Keyword Research: From Topic Clusters to Visual Proof
Content & AEO Playbook · 7 Min Read

What to Do After Keyword Research: From Topic Clusters to Visual Proof

Why top-ranking articles in 2026 pair 50-word quick answers with deterministic H2 section infographics and comparison tables.

By Sufian MustafaExplore AI SEO Playbooks
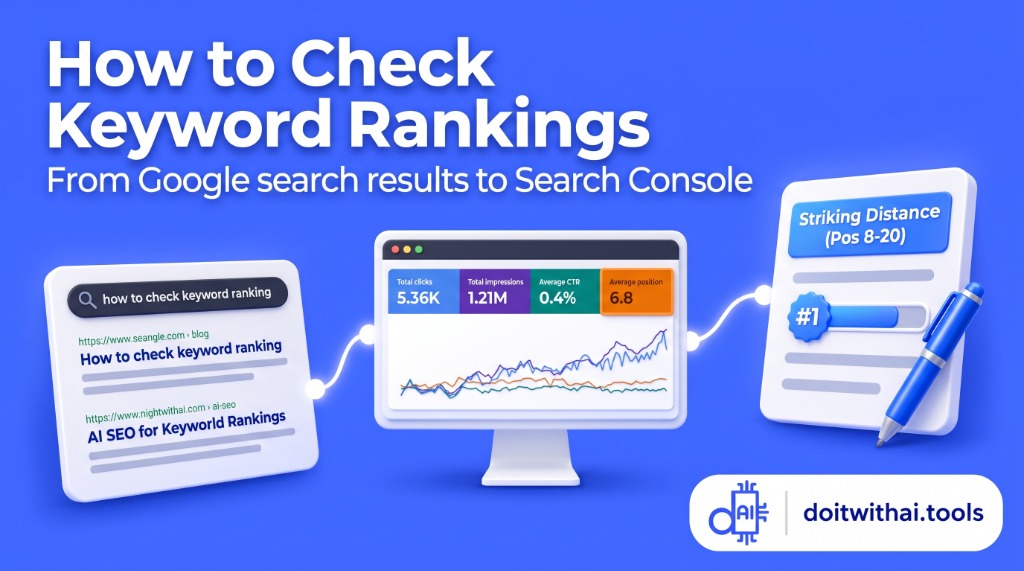
How to Check Google Keyword Rankings & Upgrade Underperforming H2s
Editorial Strategy Guide · 8 Min Read

How to Check Google Keyword Rankings & Upgrade Underperforming H2s

Identify pages stuck on Page 2 in Search Console and lift CTR and dwell time by embedding custom section diagrams.

Best Free AI Tools for Blog Infographics, Diagrams & B2B Visuals
Visual Tool Reviews · 6 Min Read

Best Free AI Tools for Blog Infographics, Diagrams & B2B Visuals

How browser-based HTML5 Canvas and vector SVG engines eliminate garbled AI text and cut content production costs to $0.

By Sufian MustafaBrowse AI Tool Reviews
Free AI Courses & Learn-and-Earn Tracks

Build, customize & monetize AI visual workflows step by step

Explore all learning tracks
Free Track · 4 Modules

Learn & Earn with AI: Ship Visual-First SEO Articles for Clients

Package keyword clusters, humanized articles, and 25-template section infographics into high-ticket content retainers.

  • Module 1: Mapping H2 search intent to visual families
  • Module 2: Brand palette & executive ring framing
  • Module 3: Zero-CLS WebP/SVG publishing & schema
No-Code Builder Track · 5 Modules

Vibe-Coding & Customizing Standalone AI Visual Studios

Download portable HTML5 Canvas and React tools from our catalog, customize templates, and embed them on your own domain.

  • Module 1: Deterministic Canvas & SVG architecture
  • Module 2: Adding custom brand themes & logos
  • Module 3: Embedding interactive visual lead magnets
Full Platform Walkthrough · Interactive

How to Do It With AI: 62-Tool Blog & Visual Production Pipeline

See how our 121+ free SEO, writing, and visual studios connect inside the Do It AI command center.

  • Step 1: Cluster keywords & validate <580px SERP titles
  • Step 2: Generate H2 section infographics across 25 layouts
  • Step 3: Export CWV HTML, JSON-LD @graph & Master .ZIP

Questions and answers

Free AI Blog Section Infographic Generator FAQs

What is the Free AI Blog Section Infographic Generator and how does it work?

The Free AI Blog Section Infographic Generator converts any H2 blog heading, bullet list, paragraph, or public article URL into a crisp, typo-free visual diagram. Unlike diffusion image generators that paint flat pixels with misspelled words, our engine renders 25 structured HTML5 Canvas and vector SVG templates that you can edit live in your browser.

How is this 25-template studio different from Napkin.ai, Canva, or Midjourney?

Diffusion generators (like Midjourney or DALL-E) frequently garble small text inside flowcharts and cost per-image API credits. Paid diagram tools lock exports behind monthly subscriptions. Our studio runs 100% free in your browser at zero token cost, maps your H2 heading to the ideal layout automatically, and exports crisp PNG, vector SVG, WebP, PDF, and zero-CLS Core Web Vitals HTML.

Which 25 blog infographic templates are included in the studio?

The studio includes 25 purpose-built templates across 6 visual families: Process & Step Flows (4-Step Pipeline, Vertical Roadmap, Growth Flywheel, Zig-Zag Journey, 4-Tier Funnel), Comparison & Versus (Battle Card, 3-Tier Matrix, Before/After Split, Pros & Cons, Do's & Don'ts), Data & KPI Callouts (4-Card Bento KPI, Spotlight Stat, Benchmark Bars, ROI Breakdown, 5-Pillar Scorecard), Frameworks & Pyramids (2x2 Quadrant, 3-Tier Pyramid, 3-Circle Venn, Hub & Spoke), Checklists & Cheat Sheets (8-Point Checklist, 5-Point TL;DR, Page Anatomy, Myth vs Reality, 6-Box Cheat Sheet), and Widescreen Blog Hero & OG Banners.

Can I upload my company logo and an author or executive portrait?

Yes. Upload your PNG, SVG, JPG, or WEBP brand logo and adjust its scale and badge container (Auto, Brand Pill, White Box, Dark Box, or Plain). You can also add an optional author portrait (or choose one of our 4 built-in male executive portraits) framed cleanly inside Concentric Rings, an Arch Frame, or an Adjustable-Radius Window with real-time pan, zoom, and radius sliders.

Does switching between the 25 templates or 4 aspect ratios erase my edited text?

Never. Your H2 headline, subheadline, node badges, titles, details, metrics, brand colors, logo, and portrait settings are stored in a unified state. Click any of the 25 live miniature canvas previews or switch between 16:9, 1:1, 4:5, and 9:16 to re-render your exact content instantaneously.

Can I extract multiple section infographics directly from a published blog URL?

Yes. Paste any public article URL into the top extractor bar. The studio extracts the key sections, auto-recommends the matching infographic template for each heading, and populates multiple visual tabs that you can download individually or together as a single .ZIP archive.

How do these infographics help with Google Core Web Vitals and SEO?

Every visual exports with explicit width and height dimensions (zero Cumulative Layout Shift, 0.000 CLS), next-gen WebP and vector SVG formats for sub-second Largest Contentful Paint (LCP), and a 1-click 'CWV HTML' button that copies semantic <figure> and <figcaption> markup with SEO alt text.

How does this tool connect to the Grand AI Blog, Article & Content Writer Studio?

This 25-template engine powers the inline H2 visuals inside our flagship AI Blog Writer, AI Content Writer, and AI Article Writer studios—allowing you to generate a complete 2,000-word SEO article with a custom infographic under every H2 section.

Is this blog infographic generator completely free for commercial use?

Yes. It is 100% free with zero signup, zero watermark, and full commercial publishing rights across client blogs, SaaS landing pages, LinkedIn carousels, and newsletters.

Can I chain this tool inside the Do It AI workspace?

Yes. Click 'Use in Do It AI' in the hero bar to open our Do It AI command center, where you can research keywords, draft your article, generate section infographics, and build social distribution posts in one connected workflow.